
Objeck Language Architecture
This document provides detailed architectural views of the Objeck programming language implementation, including the compiler, virtual machine, JIT compilation, and development tools.
Contents
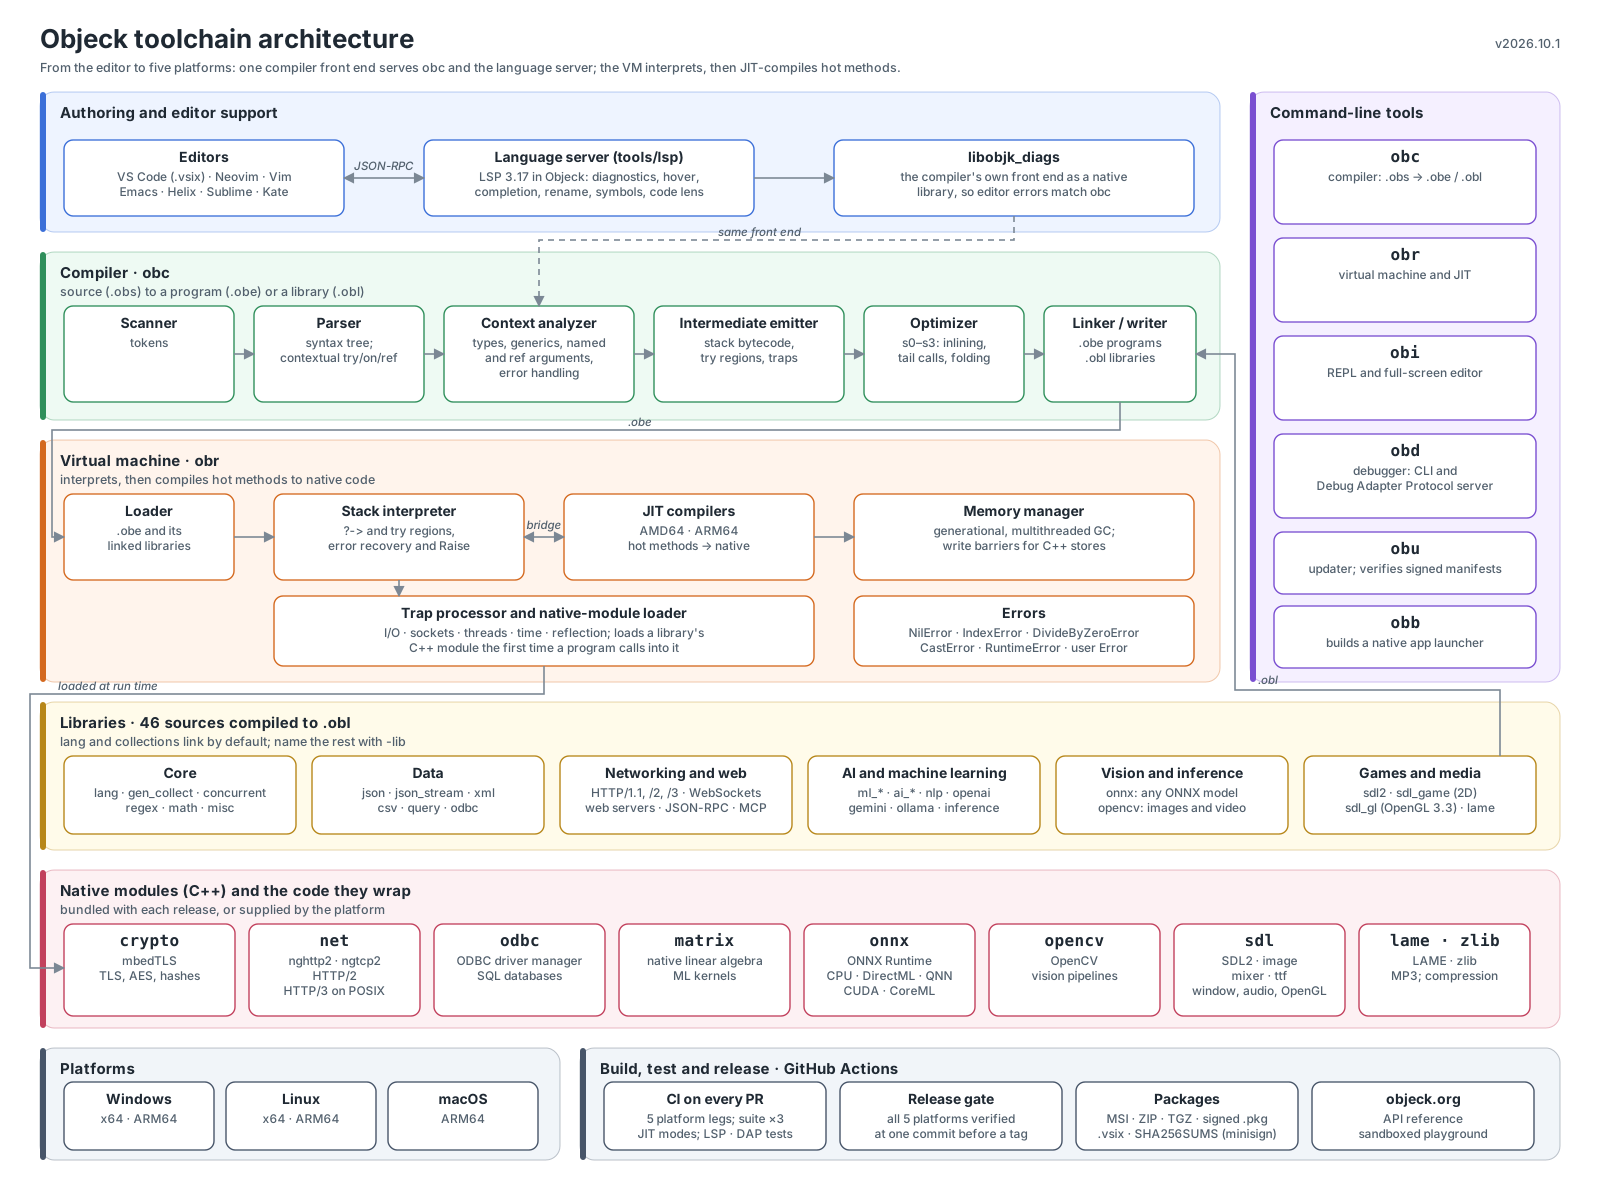
The whole toolchain on one page (SVG); the sections below go into each part. For a short written map with the invariants and the page that goes deeper on each part, see ARCHITECTURE_MAP.md.
1. Complete System Overview
The whole toolchain, from the editor to the five platforms a release ships to. Source is compiled by obc into an executable (.obe) or a library (.obl); obr runs it, interpreting until a method is hot and then compiling it to native code. The language server analyzes the same source with the compiler's own front end, linked into a native library.
flowchart LR
    subgraph AUTHOR["Authoring"]
        direction TB
        EDITORS["Editors<br/>VS Code · Neovim · Vim · Emacs<br/>Helix · Sublime · Kate"]
        LSP["Language server<br/>tools/lsp (Objeck)<br/>LSP 3.17: diagnostics, hover,<br/>completion, rename, symbols,<br/>semantic tokens, code lens"]
        DIAGS["libobjk_diags<br/>compiler front end<br/>as a native library"]
        EDITORS <-->|"JSON-RPC over stdio"| LSP
        LSP --> DIAGS
    end

    subgraph COMPILE["Compiler · obc"]
        direction TB
        SRC[".obs source"]
        FRONT["Scanner → Parser<br/>→ Context analyzer<br/>types, generics, named and<br/>ref arguments, try/on/finally"]
        BACK["Intermediate emitter<br/>→ Optimizer s0–s3<br/>(inlining, tail calls,<br/>constant folding)"]
        LINK["Linker<br/>reads .obl libraries"]
        OUT[".obe program<br/>.obl library"]
        SRC --> FRONT --> BACK --> OUT
        LINK --> FRONT
    end

    subgraph RUN["Virtual machine · obr"]
        direction TB
        LOAD["Loader"]
        INTERP["Stack interpreter<br/>?-> and try regions,<br/>error recovery"]
        JIT["JIT compilers<br/>AMD64 · ARM64<br/>hot methods → native"]
        GC["Memory manager<br/>generational GC,<br/>multithreaded"]
        TRAPS["Trap processor<br/>I/O · sockets · threads<br/>time · native calls"]
        LOAD --> INTERP
        INTERP <-->|"bridge, statuses"| JIT
        INTERP <--> GC
        JIT <--> GC
        INTERP --> TRAPS
    end

    subgraph LIBS["Libraries · 46 sources, .obl"]
        direction TB
        CORE["lang · collections · concurrency<br/>regex · math · misc"]
        DOMAIN["Data · Networking · Web<br/>AI and ML · Media"]
        NATIVE["Native modules<br/>.dll · .so · .dylib<br/>(see the library stack below)"]
        DOMAIN --> NATIVE
    end

    subgraph TOOLS["Command-line tools"]
        direction TB
        OBI["obi · REPL and editor"]
        OBD["obd · debugger<br/>CLI and Debug Adapter Protocol"]
        OBU["obu · updater<br/>signed release manifests"]
        OBB["obb · app builder<br/>native launchers"]
    end

    subgraph PLAT["Platforms"]
        direction TB
        WIN["Windows x64 · ARM64"]
        LNX["Linux x64 · ARM64"]
        MAC["macOS ARM64"]
    end

    subgraph SHIP["Build, test and release"]
        direction TB
        CI["GitHub Actions<br/>CI on 5 platform legs<br/>regression suite ×3 JIT modes<br/>LSP, DAP, debugger tests"]
        REL["Release build and publish<br/>MSI · ZIP · TGZ · signed .pkg<br/>.vsix · SHA256SUMS (minisign)"]
        SITE["objeck.org API docs<br/>playground (sandboxed)"]
        CI --> REL --> SITE
    end

    DIAGS -.->|"same front end"| FRONT
    EDITORS -->|"debug sessions"| OBD
    OUT --> LOAD
    CORE --> LINK
    DOMAIN --> LINK
    NATIVE -->|"loaded at run time"| TRAPS
    OBI --> FRONT
    OBI --> INTERP
    OBD <--> INTERP
    OBU --> REL
    TRAPS --> PLAT
    JIT --> PLAT
    COMPILE -.-> CI
    RUN -.-> CI
The library stack
Most libraries are Objeck alone. The rest pair an Objeck interface with a C++ module that the VM loads when the program first calls it, and that module wraps the third-party code a release bundles or the platform supplies.
flowchart TB
    subgraph OBJECK["Objeck libraries (.obl)"]
        direction LR
        L_CORE["lang · gen_collect<br/>concurrent · regex · misc"]
        L_DATA["json · json_stream · xml<br/>csv · query · odbc"]
        L_NET["net · net_h2 · net_quic<br/>net_server · web_server<br/>json_rpc · rss · cipher"]
        L_AI["ml_* · ai_* · nlp · nlp_onnx<br/>ai_hub (Hugging Face Hub)<br/>openai · gemini · ollama<br/>models · inference"]
        L_VISION["onnx · opencv"]
        L_MEDIA["sdl2 · sdl_game · sdl_gl<br/>lame"]
        L_TOOLS["diags"]
    end

    subgraph MODULES["Native modules (C++)"]
        direction LR
        M_CRYPTO["crypto"]
        M_NET["net / TLS"]
        M_ODBC["odbc"]
        M_MATRIX["matrix"]
        M_ONNX["onnx"]
        M_CV["opencv"]
        M_SDL["sdl"]
        M_LAME["lame"]
        M_DIAGS["diags"]
    end

    subgraph THIRD["Third-party and system code"]
        direction LR
        T_TLS["mbedTLS"]
        T_HTTP["nghttp2 (HTTP/2)<br/>ngtcp2 + nghttp3 (HTTP/3, POSIX)"]
        T_ODBC["ODBC driver manager"]
        T_ORT["ONNX Runtime<br/>CPU · DirectML · QNN<br/>CUDA · CoreML"]
        T_CV["OpenCV"]
        T_SDL["SDL2 · image · mixer · ttf<br/>OpenGL 3.3 core"]
        T_LAME["LAME (MP3)"]
        T_ZLIB["zlib"]
        T_CC["obc front end"]
    end

    L_NET --> M_CRYPTO & M_NET
    L_DATA --> M_ODBC
    L_AI --> M_MATRIX
    L_AI -->|"model inference"| M_ONNX
    L_VISION --> M_ONNX & M_CV
    L_MEDIA --> M_SDL & M_LAME
    L_TOOLS --> M_DIAGS
    L_CORE -->|"compression"| T_ZLIB

    M_CRYPTO & M_NET --> T_TLS
    M_NET --> T_HTTP
    M_ODBC --> T_ODBC
    M_ONNX --> T_ORT
    M_CV --> T_CV
    M_SDL --> T_SDL
    M_LAME --> T_LAME
    M_DIAGS --> T_CC
Key components:
- Compiler (
obc): scanner, parser and context analyzer, an intermediate emitter, an optimizer with four levels (s0–s3, s3 by default), and a linker that reads.obllibraries. Libraries record their methods' parameter names and type parameters, so named arguments and generic inference work across binaries. - VM (
obr): a stack interpreter that JIT-compiles hot methods for AMD64 and ARM64. Errors under?->ortryrecover in either mode; a compiled method reports a status the interpreter that owns the handler acts on. - Memory: generational, multithreaded garbage collection; C++ code that stores into an old object takes a write barrier.
- Language server: written in Objeck (
tools/lsp), analyzing with the compiler's own front end throughlibobjk_diags, so editor diagnostics matchobc. - Tools:
obi(REPL and full-screen editor),obd(debugger, also a Debug Adapter Protocol server),obu(updater that verifies signed manifests),obb(builds a native launcher for a program). - Libraries: 56 library sources; native modules wrap mbedTLS, nghttp2/ngtcp2, ODBC, ONNX Runtime, OpenCV, SDL2 and LAME.
- CI and release: five platform legs on every pull request, the regression suite in three JIT modes, LSP, DAP and debugger tests, and a release gate that verifies all five platforms at one commit before tagging.
2. Compiler Pipeline
Detailed compilation flow from source to bytecode with optimization stages.
flowchart LR
    subgraph "Frontend"
        A[Source .obs] --> B[Scanner]
        B --> C[Parser]
        C --> D[AST]
        D --> E[Contextual Analyzer]
    end

    subgraph "Optimization Pipeline"
        E --> F[Intermediate Code]
        F --> G{Optimization Level?}

        G -->|s0 None| H[Skip Optimization]
        G -->|s1 Basic| I[Constant Folding<br/>Dead Code Removal]
        G -->|s2 Moderate| J[+ CSE, Loop-Invariant Motion<br/>+ Strength Reduction]
        G -->|s3 Aggressive| K[+ Method Inlining<br/>+ Instruction Replacement<br/>+ Peephole Optimization]

        H --> L[Bytecode]
        I --> L
        J --> L
        K --> L
    end

    subgraph "Backend"
        L --> M[Linker]
        N[Libraries .obl] --> M
        M --> O[Executable .obe]
    end

    style G fill:#fff4e1
    style K fill:#e1ffe1
Optimization Levels
| Level | Name | Optimizations | Use Case |
|---|---|---|---|
| s0 | None | No optimization | Fast compilation, debugging |
| s1 | Basic | Constant folding, dead code elimination | Development builds |
| s2 | Moderate | + Common-subexpression elimination, loop-invariant code motion, strength reduction | Testing |
| s3 | Aggressive | + Method inlining (not in libraries), instruction replacement, peephole optimization | Production (default) |
Optimization Passes (s3)
In the order ItermediateOptimizer runs them on each method, once each; the method inliner runs last, after every method of the class has been through the rest.
graph TD
    A[Intermediate Code] --> B[Jump Cleanup]
    B --> C[Dead Block Elimination]
    C --> D[Tail Calls, Getter/Setter Inlining]
    D --> E[Constant Propagation]
    E --> F[Dead Store Removal]
    F --> G[CSE, Loop-Invariant Motion]
    G --> H[Constant Folding]
    H --> I[Strength Reduction]
    I --> J[Instruction Replacement, Peephole]
    J --> K[Dead Code Elimination]
    K --> L[Method Inlining]
    L --> M[Optimized Bytecode]

    style A fill:#e1f5ff
    style M fill:#e1ffe1
Performance Impact:
- s0 → s3: ~30-40% faster execution
- s0 → s3: ~10-15% smaller bytecode
- Compilation time: s0 = 1x, s3 = 1.5x
Source Files:
core/compiler/optimization.h/cpp- Optimization enginecore/compiler/intermediate.h/cpp- IR generationcore/compiler/emit.h/cpp- Bytecode emission
3. Virtual Machine Runtime
Execution model with interpreter and JIT compilation.
flowchart TB
    subgraph "VM Initialization"
        A[Load Bytecode .obe] --> B[Parse Program Header]
        B --> C[Load Class Metadata]
        C --> D[Initialize Memory Manager]
    end

    subgraph "Execution Engine"
        D --> E[Runtime Interpreter]
        E --> F{Hot Code?}

        F -->|"not yet"| E
        F -->|"10th call, or first call<br/>of a method with a loop"| G[Compile Method]

        G --> H{Platform?}
        H -->|ARM64| I[ARM64 JIT Compiler]
        H -->|x64| J[AMD64 JIT Compiler]

        I --> K[JIT Code Cache]
        J --> K

        K --> L[Execute Native Code]
        L --> M{More Code?}
        M -->|Yes| F
        M -->|No| N[Exit]
    end

    subgraph "Memory Management"
        O[Memory Manager]
        O <--> E
        O <--> I
        O <--> J
        O <--> L
    end

    subgraph "Host Interaction"
        P[Host APIs]
        E --> P
        L --> P
        P --> Q[File I/O, Network, Graphics]
    end

    style F fill:#fff4e1
    style K fill:#e1ffe1
    style O fill:#ffe1e1
Execution Modes
stateDiagram-v2
    [*] --> Interpreted
    Interpreted --> Counting: Called
    Counting --> JIT_Compiling: 10th call, or first call with a loop
    JIT_Compiling --> Interpreted: Pre-scan rejects the method
    JIT_Compiling --> Native_Execution: Compilation complete
    Native_Execution --> [*]: Method returns

    note right of Counting
        Call count tracked
        per method; no
        deoptimization
    end note

    note right of JIT_Compiling
        Platform-specific
        ARM64 or AMD64
    end note
Memory Layout
graph TB
    subgraph "Memory Regions"
        A[Operand and Call Stacks]
        B[Nursery, bump-allocated]
        C[Old Generation]
    end

    A -->|"Roots: locals, frames"| F[Memory Manager]
    B -->|New objects| F
    C -->|"Promoted objects, arrays,<br/>native allocations"| F

    F -->|"O(1) membership"| G[Old-gen address set]
    F -->|GC| H["Minor: promote survivors<br/>Major: mark and sweep"]

    style F fill:#ffe1e1
    style G fill:#e1f5ff
Key Features:
- Tiered Execution: Interpreter → call counting → JIT
- Hot Code Detection: Automatic at 10 calls (default; configurable via
--jit=<calls>orOBJECK_JIT_THRESHOLD). A method with a loop is compiled on its first call instead, which is howMaingets compiled, and a thread'sRunwith a loop on entry; seedocs/JIT_ENTRY_COMPILE_DESIGN.md - Platform-Specific JIT: Separate compilers for ARM64/x64
- Efficient Memory: O(1) object lookups, generational GC
Call Depth
Each VM thread has its own call stack: an array of frame pointers, with the operand stack beside it (core/vm/call_stack.h). Calls may nest 16,384 frames deep by default; obr --call-depth=<frames> (or OBJECK_CALL_DEPTH) sets it, from 256 to 1,048,576. Until 2026-10 the limit was a fixed 256 frames, which the Rosetta "Man or boy" test (647 frames at k=10) and a recursive-descent parser on input nested a few hundred deep both exceeded.
- Reserved, then committed as it deepens. A thread reserves address space for the maximum -- 8 bytes a frame, and 8 operand-stack words a frame -- and commits it as the stack grows, so an idle thread holds a page of frame array and 32 KB of operand stack, not the maximum. Measured on Windows x64 with 1,000 threads: the working set per thread is unchanged (94 KB idle). Frames themselves come from a per-thread pool, as before.
- The operand stack is checked. An interpreted frame can leave values on it across a call (
Sum(n - 1) + nkeepsn), one word a frame for plain recursion. Nothing checked it when it was 768 words; each interpreted call now checks that 1,024 words are left. - The native stack is checked. A compiled frame is on the machine stack (about 520 bytes for a small method on x64), and so is each interpreter a JIT bridge starts. The compiled call site compares the stack pointer with the thread's floor -- its stack's lowest address plus 1 MB -- as well as the depth with the committed limit; the bridge and the interpreter's call into compiled code test the floor too. So running out of native stack is the same
call stack bounds have been exceedederror, and recovers the same way. On Windows a thread the VM starts reserves 16 MB of native stack (1 KB a frame plus 2 MB for a larger--call-depth), andobr.exeandobi.exereserve 32 MB for the main thread, so compiled code reaches the maximum. On Linux and macOS a thread gets 8 MB (macOS's default was 512 KB), more only for a--call-depthabove the default, and the main thread has whatulimit -sgives it, typically 8 MB: about 12,000 small compiled frames, so there a compiled recursion stops before the maximum -- with the same error. Bigger POSIX stacks are not free: where transparent huge pages are on for every mapping, 2 MB pages back thread stacks, and 100 idle threads measured 48 MB resident with 8 MB stacks and 86 MB with 18 MB ones. - Full is a recoverable error. At the maximum, the error is a
RuntimeErrorthattry/onand?->recover from, compiled or interpreted (core_call_depth_max.obs). Unhandled, the listing shows the innermost 40 and outermost 10 frames and counts the rest. Runtime->GetProperty("runtime.call.depth_max")reports the maximum.
Source Files:
core/vm/interpreter.h/cpp- Bytecode interpretercore/vm/call_stack.h- A thread's call and operand stacks, and the depth limitscore/vm/arch/jit/jit_common.h/cpp- JIT infrastructurecore/vm/arch/memory.h/cpp- Memory management
4. JIT Compilation Architecture
Platform-specific native code generation for ARM64 and AMD64.
graph TB
    subgraph "JIT Compilation Flow"
        A[Hot Method Detected] --> B{Select Platform}

        B -->|ARM64| C1[ARM64 JIT Compiler]
        B -->|AMD64| C2[AMD64 JIT Compiler]

        C1 --> D1[AArch64 Register Allocation]
        C2 --> D2[x86-64 Register Allocation]

        D1 --> E1[ARM64 Instruction Selection]
        D2 --> E2[x64 Instruction Selection]

        E1 --> F1[Generate AArch64 Code]
        E2 --> F2[Generate x86-64 Code]

        F1 --> G[Link with Memory Manager]
        F2 --> G

        G --> H[Store in Code Cache]
        H --> I[Execute Native Code]
    end

    subgraph "ARM64 Specifics"
        J1[30 General Purpose Registers]
        J2[NEON SIMD Support]
        J3[Conditional Select, csel]
        J4[Fixed 32-bit Instructions]
    end

    subgraph "AMD64 Specifics"
        K1[16 General Purpose Registers]
        K2[SSE/AVX SIMD Support]
        K3[Variable Length Instructions]
        K4[Complex Addressing Modes]
    end

    C1 -.-> J1 & J2 & J3 & J4
    C2 -.-> K1 & K2 & K3 & K4

    style C1 fill:#e1f5ff
    style C2 fill:#e1f5ff
    style H fill:#e1ffe1
Calls between compiled methods. Since v2026.9.1 a compiled caller enters a compiled callee's native entry directly — arguments in the caller's outgoing area, the frame record built in the callee's own frame, the result in XMM0 (D0 on ARM64) — with an inline cache at virtual and func-ref sites. The C++ callback bridge remains the slow path (a callee not yet compiled, a full call stack, a Nil receiver, a megamorphic site) and the only path for allocation, traps and conversions. A bound call costs 5.5 ns rather than 26.5 ns as a result. The call path is drawn in core/vm/arch/jit/README.md; the design and its measurements are in docs/JIT_CALLING_CONVENTION_DESIGN.md.
JIT Frame Structure
graph TD
    subgraph "JIT Function Frame"
        A[Prolog: Save registers]
        B[Link with Memory Manager]
        C[Store Local Variables]
        D[Execute Generated Code]
        E[Error Handling Routines]
        F[Epilog: Restore registers]

        A --> B --> C --> D --> E --> F
    end

    subgraph "Memory Manager Integration"
        G[GC Safepoints]
        H[Object Allocation]
        I[Write Barriers]
    end

    B -.-> G & H & I
    D -.-> G & H & I

    style B fill:#ffe1e1
    style D fill:#e1ffe1
Register Allocation Strategy
The registers each backend's allocator hands out; neither spills, so an expression that needs more falls back to the interpreter whole.
| Platform | General Purpose | Float/Vector | Reserved |
|---|---|---|---|
| ARM64 | x0-x7, x12-x15 (12 regs) | d0-d15 (16 regs) | x9-x11 (scratch), x19 (safepoint flag's address), x29 (FP), x30 (LR) |
| AMD64 | rax, rbx, rcx, rdx, r8-r11 (8 regs; Windows adds rsi, rdi) | xmm10-xmm15 (6 regs) | r12 (safepoint flag's address), r13-r15 (pinned loop locals), rsp (SP), rbp (BP) |
Source Files:
core/vm/arch/jit/arm64/jit_arm_a64.h/cpp- ARM64 JITcore/vm/arch/jit/amd64/jit_amd_lp64.h/cpp- AMD64 JITcore/vm/arch/jit/jit_common.h/cpp- Shared JIT infrastructure
5. Library Ecosystem
56 library sources providing comprehensive functionality.
mindmap
    root((Objeck Libraries
    56))
        Core Runtime
            lang: runtime, errors, strings
            gen_collect: Vector, Map, Hash, List
            concurrent: locks, Condition, Semaphore, Barrier
            math: Rational, Complex
            regex · misc · diags
        Machine Learning
            ml_core · ml_data
            ml_linear · ml_tree · ml_bayes
            ml_neighbors · ml_cluster · ml_svm · ml_outlier
            nlp: tokenizers (WordPiece, BPE), TF-IDF, sentiment
        AI
            onnx: in-process inference, face detection and recognition
            nlp_onnx: BERT embeddings, Hugging Face text classifiers
            ai_hub: Hugging Face Hub downloads into a verified cache
            inference: model server over HTTP
            models: shared Tensor and Engine
            openai · gemini · ollama
            ai_search · ai_game · ai_optimize · ai_rl
            opencv: computer vision
        Web & Networking
            net · net_common · net_secure
            net_h2 · net_quic
            net_server · web_server
            json_rpc · rss
        Data Processing
            json · json_stream · xml
            csv · query · odbc
            cipher: hashing and encryption via mbedTLS
        Media & Gaming
            sdl2 · sdl_game · sdl_gl
            lame: MP3 encoding
Library Dependencies
graph TB
    subgraph "Core Dependencies"
        A[lang.obl] --> B[All Libraries]
    end

    subgraph "AI/ML Stack"
        C[onnx.obl] --> D[ONNX Runtime]
        E[opencv.obl] --> F[OpenCV 4.12]
        G[ml_*.obl] --> H[matrix module · Eigen3]
        I[ollama.obl] --> J[HTTP Client]
        K[openai.obl] --> J
        L[gemini.obl] --> J
        HUB[ai_hub.obl] --> J
        NO[nlp_onnx.obl] --> C
    end

    subgraph "Web Stack"
        M[web_server.obl] --> N[net_server.obl]
        O[json_rpc.obl] --> P[json.obl]
        N --> Q[net_secure.obl]
        Q --> R[mbedTLS 3.6]
    end

    subgraph "Data Stack"
        S[json.obl]
        T[xml.obl]
        U[csv.obl]
        V[query.obl] --> S & T & U
    end

    subgraph "Media Stack"
        W[sdl2.obl] --> X[SDL2]
        Y[sdl_game.obl] --> W
        Z[lame.obl] --> AA[LAME 3.100]
    end

    style D fill:#e1f5ff
    style F fill:#e1f5ff
    style R fill:#ffe1e1
    style X fill:#fff4e1
External Dependencies
Versions differ by platform (vcpkg, vendored DLLs, apt, Homebrew, static builds); the per-platform table, and how to check each one, is in third_party_dependencies.md.
| Category | Library | Purpose |
|---|---|---|
| Crypto | mbedTLS 3.6 LTS | TLS, hashing, encryption |
| HTTP | nghttp2; ngtcp2 + nghttp3 + AWS-LC (POSIX) | HTTP/2, HTTP/3 |
| ML/AI | ONNX Runtime (CPU, DirectML, QNN, CUDA, CoreML) | Neural network inference |
| Vision | OpenCV 4.12 | Computer vision, image processing |
| Math | Eigen 3.4 (vendored) | Linear algebra, matrices |
| Graphics | SDL2, SDL2_image, SDL2_mixer, SDL2_ttf | Cross-platform graphics/input/audio |
| Audio | LAME 3.100 | MP3 encoding |
| Database | ODBC | System driver manager |
Face Recognition Example
use API.OpenCV, API.Onnx;

class FaceDemo {
  function : Main(args : String[]) ~ Nil {
    session := FaceSession->New("det_10g.onnx", "w600k_r50.onnx");

    img1 := Image->Load("person_a.jpg")->Convert(Image->Format->JPEG);
    img2 := Image->Load("person_b.jpg")->Convert(Image->Format->JPEG);

    r1 := session->Recognize(img1, 0.5);
    r2 := session->Recognize(img2, 0.5);

    faces1 := r1->GetResults();
    faces2 := r2->GetResults();
    sim := FaceSession->Compare(faces1[0]->GetEmbedding(), faces2[0]->GetEmbedding());
    "Similarity: {$sim}"->PrintLine();   # >0.35 = same person
    session->Close();
  }
}
Uses SCRFD 10G-KPS detector + ArcFace R50 recognizer from InsightFace buffalo_l. Runs on DirectML (Windows), CPU/CUDA (Linux), CoreML (macOS).
Source Files:
core/compiler/lib_src/*.obs- Library source code (46 files)core/lib/*.obl- Compiled libraries, shipped in a release'slib/
6. Development Tools
Interactive development environment with REPL, debugger, and LSP support.
graph TB
    subgraph "REPL (Interactive Shell)"
        A[User Input] --> B[Command Parser]
        B --> C{Command Type?}

        C -->|Code| D[Scanner]
        C -->|File| E[Load File]
        C -->|Command| F[Execute Command]

        D --> G[Parser]
        E --> G
        G --> H[Contextual Analyzer]
        H --> I[Interpreter]
        I --> J[Display Result]

        F --> K[REPL Commands]
        K --> J
    end

    subgraph "Integrated Editor"
        L[Syntax Highlighting]
        M[Undo / Redo]
        N[F5 Run Pane]
    end

    A -.-> L & M & N

    style I fill:#e1ffe1
    style J fill:#fff4e1
Debugger Architecture
sequenceDiagram
    participant User
    participant Debugger
    participant VM
    participant Memory

    User->>Debugger: Set breakpoint at line 42
    Debugger->>VM: Install breakpoint

    User->>Debugger: Run program
    Debugger->>VM: Start execution

    VM->>VM: Execute bytecode
    VM->>Debugger: Hit breakpoint at line 42

    User->>Debugger: Inspect variable 'x'
    Debugger->>VM: Get stack frame
    VM->>Memory: Lookup variable 'x'
    Memory->>VM: Return value
    VM->>Debugger: Variable value
    Debugger->>User: Display: x = 42

    User->>Debugger: Step over
    Debugger->>VM: Execute next instruction
    VM->>Debugger: Paused at line 43

    User->>Debugger: Continue
    Debugger->>VM: Resume execution
    VM->>VM: Run to completion
LSP Server Integration
graph LR
    subgraph "Editors (tools/lsp/clients)"
        A1[VS Code]
        A2[Neovim]
        A3[Vim]
        A4[Emacs]
        A5[Helix]
        A6[Sublime Text]
    end

    subgraph "LSP Server (tools/lsp, LSP 3.17)"
        B[Language Server Protocol]
        C[Analysis, reused until the text changes]
        D[Symbol Table]
        E[Pull Diagnostics]
    end

    subgraph "Compiler Services (libobjk_diags)"
        F[Scanner]
        G[Parser]
        H[Contextual Analyzer]
    end

    A1 & A2 & A3 & A4 & A5 & A6 --> B
    B --> C --> F & G & H
    C --> D
    C --> E

    style B fill:#e1f5ff
    style D fill:#fff4e1
An analyzed program is keyed by the exact texts of its files and its library list. Diagnostics analyze each edit; hover and completion work from the last program that analyzed cleanly. Since v2026.10.2 an edit retires programs rather than freeing them, and a request whose texts and libraries match a retired program reuses it, so each edit is analyzed once instead of twice (about 2× faster per edit). Unclaimed programs are freed at the next edit, and OBJECK_LSP_NO_CACHE=1 turns all reuse off.
REPL Features
- Interactive Evaluation: Execute code line-by-line
- Syntax Highlighting: In the full-screen editor (
/e); the line prompt colors only its prompt, status and errors - No history or completion yet: the line prompt is plain line entry
- File Loading: Execute entire files
- Inline/File Modes: Switch between modes
Full-Screen Editor (/e)
A terminal editor over the REPL buffer, header-only (core/repl/{term,screen,keymap,tui_editor,highlight,child_run}.h) so it adds no build-system changes on any platform. Raw-mode input and damage-diffed rendering work identically on Windows (VT console) and POSIX (termios), with display-width handling for CJK/wide characters.
- Editing: movement, selection (Shift+arrows), undo/redo with coalesced typing, an internal clipboard (Ctrl+C/X/V)
- Run pane (F5): compiles the buffer with
obcand runs it withobras child processes, started from an argument vector with no shell, and streams their merged output into a pane; Esc cancels a run, F8 jumps the cursor through compile errors. The in-process VM cannot run off the main thread, which is why the run is a child - Binding profiles: a notepad-style default and an opt-in
viprofile (F2) — a second binding table plus a mode field over the same actions, not a second editor - Read-only shell: the REPL's class/function frame is dimmed and protected at both the view and model level
Software Updater (obu)
core/utils/updater/obu.cpp — in-place version upgrades without reinstalling. obu check compares the installed version against GitHub releases; obu update/rollback download the platform archive, verify a SHA-256 digest against the release's SHA256SUMS before touching disk, then perform an all-or-nothing staged swap with an obc -v post-install check and automatic rollback. No shell is used anywhere — curl/tar/obc run via argument vectors (fork/execvp on POSIX, CreateProcess on Windows), including the release-JSON fetch behind obu check. The flow is covered by an offline CI test (test_update.py) that runs on both Linux and Windows: check is exercised on every platform against fake releases, and the update/rollback swap plus a command-injection PoC wherever the swap is implemented. The Windows swap needs no re-exec dance: Windows forbids deleting a running image but allows renaming one, so the running obu.exe moves into .previous and keeps executing. Since v2026.10.0 a release's SHA256SUMS is itself signed with minisign, and obu refuses a manifest whose signature does not verify against the release key compiled into it, so a substituted archive cannot pass with a substituted manifest. Still outstanding (docs/UPDATER_DESIGN.md): reconciling an MSI-managed install's registry entries, and elevation against a real Program Files tree.
Debugger Features
- Breakpoints: Set/remove at any line
- Step Execution: Step over, step into, step out
- Stack Inspection: View call stack at any depth
- Variable Viewing: Inspect locals and instance variables
- Expression Evaluation: Evaluate expressions in context
- Memory Inspection: View heap objects
Source Files:
core/repl/repl.h/cpp- REPL implementationcore/repl/editor.h/cpp- Integrated line editorcore/repl/{term,screen,keymap,tui_editor,highlight,child_run}.h- full-screen editorcore/debugger/debugger.h/cpp- Debugger corecore/debugger/obj_layout.h- shared object/collection layout (CLI + DAP)core/debugger/parser.h/cpp- Debug command parsercore/utils/updater/obu.cpp- software updater
7. CI/CD Pipeline
Automated multi-platform testing and build system.
graph TB
    subgraph "GitHub Actions Trigger"
        A[Push to master] --> B[GitHub Actions]
        C[Pull Request] --> B
    end

    subgraph "Multi-Platform Matrix Build"
        B --> D{Platform Matrix}

        D -->|Linux x64| E1[Ubuntu Latest]
        D -->|Linux ARM64| E4[ubuntu-24.04-arm]
        D -->|macOS ARM64| E2[macos-15]
        D -->|Windows x64| E3[windows-2025-vs2026]
        D -->|Windows ARM64| E5[windows-11-arm]
    end

    subgraph "Build Process"
        E1 & E2 & E3 & E4 & E5 --> F[Install Dependencies]

        F --> G{Cache Hit?}
        G -->|Yes| H[Restore Cache]
        G -->|No| I[Download & Install]

        H & I --> J[Build Toolchain]
        J --> K[Compile Tests]
    end

    subgraph "Testing"
        K --> L[Run Deployment Tests]
        L --> M[Run Regression Suite]
        M --> N{All Tests Pass?}

        N -->|Yes| O[Upload Artifacts]
        N -->|No| P[Report Failure]
    end

    subgraph "Artifacts & Reporting"
        O --> Q[Build Artifacts<br/>7-day retention]
        O --> R[Generate API Docs]
        P --> S[CI Status Badge]
    end

    style N fill:#fff4e1
    style O fill:#e1ffe1
    style P fill:#ffe1e1
Platform Matrix
| Platform | Runner | Architecture | Compiler | Tests |
|---|---|---|---|---|
| Linux | ubuntu-24.04 | x64 | GCC | 529 regression |
| Linux | ubuntu-24.04-arm | ARM64 | GCC | 529 regression |
| macOS | macos-15 | ARM64 (Apple silicon) | Clang | 529 regression |
| Windows | windows-2025-vs2026 | x64 | MSVC (v145) | 529 regression |
| Windows | windows-11-arm | ARM64 | MSVC (v143) | 529 regression |
Every leg builds natively and runs what it builds: the regression suite twice, at the default JIT threshold and with every method compiled on its first call (OBJECK_JIT_THRESHOLD=1), then the debugger, DAP and VM-flag tests. The Windows ARM64 leg used to be cross-compiled on an x64 host, which cannot execute what it builds, so its tests were skipped. That blind spot is how an ARM64-only miscompile reached six releases before anyone noticed. The release build still cross-compiles Windows ARM64 on the x64 image; CI's native leg is what tests it.
Caching Strategy
graph LR
    subgraph "Linux Cache"
        A1[APT Packages] --> B1[500MB]
        A2[ccache Objects] --> B2[500MB]
    end

    subgraph "macOS Cache"
        C1[Homebrew Bottles] --> D1[1GB]
        C2[ccache Objects] --> D2[500MB]
    end

    subgraph "Cache Management"
        E[Cache Key: workflow + commit]
        F[Restore Key: workflow]
        G["GitHub evicts at the<br/>10 GB repo ceiling"]
        H["codeql.yml prunes<br/>superseded entries"]
    end

    B1 & B2 & D1 & D2 --> E
    E --> F --> G
    H --> G

    style E fill:#e1ffe1
    style H fill:#e1ffe1
The 10 GB ceiling is the constraint that matters. Actions caches are capped per repository, and past the cap GitHub evicts the oldest entries -- which is how a release build lost its dependency caches and gained about forty minutes. The families that grow without bound are the ones whose key embeds something that changes: CodeQL writes a ~460 MB TRAP cache per analysed commit, and the dependency caches re-key whenever their input hash moves. A superseded entry can never be hit again, because the key names it.
A prune-caches job in codeql.yml therefore keeps only the newest few of each family, taking <prefix>:<keep> pairs -- currently codeql-trap:3 macOS-brew-downloads:2 Linux-x64-apt:2 Linux-arm64-apt:2. It keeps several rather than one because these actions restore by key prefix, so a recent entry still warm-starts a new run; pruning to exactly one would trade the ceiling problem for a slower build.
Regression Test Suite
782 tests under programs/regression/, grouped by the prefix on each filename. The counts change with almost every pull request, so they are not repeated here: programs/regression/TESTS.md (generated) has the current number per category.
mindmap
    root((Regression Tests
    782 total))
        Language core
            core_*
                Arithmetic, arrays, classes, generics, strings
        Rejected programs
            bad_*
                Errors the compiler must refuse
        JIT
            jit_*
                Native compilation, float paths, GC interaction
        Machine learning
            ml_*
                System.ML models and inference
        Fixed defects
            fix_*
                Regressions pinned to the bug that caused them
        Collections
            collect_*
                Vector, Hash, Map, Set, Stack, Queue
        Math and strings
            math_* string_* func_*
                Numerics, formatting, higher-order functions
        ARM64 specific
            arm64_*
                Bitwise, char arrays, 64-bit immediates, multiply
        Networking and web
            http_* mcp_* xml_* json_* api_*
                Clients, servers, serialisation
        Rosetta Code tasks
            rosetta_*
                Programs from Rosetta Code, output checked
        Remainder
            closure_* try_* vm_* gc_* opt_* dap_* debugger_* onnx_* and others
                Closures, error handling, the VM and its collector, AI bindings, debugger
8. Memory Management
Multithreaded Collection (Cooperative Stop-the-World)
With multiple threads running, a collection cannot begin until every other thread has reached a known-safe point. Objeck uses a cooperative stop-the-world scheme rather than OS thread suspension:
- Safepoints. The interpreter polls a safepoint every 1,024 instructions of its dispatch loop, and every allocation polls too. When a collection is requested, threads observe the request at their next safepoint and park until it completes. The AMD64 and ARM64 JITs emit the same poll at every loop header, so JIT-compiled code parks just as promptly; a compiled loop that starts with values still pending in registers spills them to the frame's scratch slots before it parks and reloads them after, because a register cannot be relocated.
- Blocking calls. A thread about to block in a syscall (thread
Join/sleep, socket I/O) brackets the call with begin/end-blocking markers so it counts as already parked — a collection never waits on a thread stuck in a blocking read. - Root scanning. Once all threads are parked, the collector marks from every thread's roots: static fields, each thread's full call stack including the currently-executing top-level frame, and each thread's operand stack. The set of roots scanned by the mark phase is exactly the set the fixup phase rewrites, so a live object can never be reclaimed while a reference to it survives in a parked thread's frame or operand stack.
- Typed and untyped roots. A frame's declared locals are walked by type, so only object slots are followed. Some frame words have no declaration and are scanned conservatively: a word is treated as a reference only if it is the address of a live object, and relocated only through a genuine forwarding address. These are the operand stacks, the JIT's scratch slots, and a method's and/or slot, where a conditional (
c ? a : b) leaves its value between the branch that stores it and the load after the join. A collection can fall in that gap, so the slot is a root in interpreted and compiled frames alike; before v2026.10.2 it was walked over, and a promoted object could be read back through its old nursery address.
The collector remains generational and non-OS-suspending; correctness comes from complete root coverage at the safepoint, not from freezing threads mid-instruction.
Old-Generation Membership
The collector must answer "is this address a live old-generation object?" for words taken from conservative scans — operand stacks and JIT temporaries — which may not be pointers at all. That rules out reading a flag from the candidate: the answer has to be decidable without dereferencing it. An object's header does carry GC_OLD_BIT, but reading it means trusting the address first.
So the old generation keeps a set of known-good addresses, PtrSet (core/vm/arch/ptr_set.h). It is open-addressed: keys live directly in one power-of-two array, probed linearly, with nullptr for an empty slot and an all-ones sentinel for a tombstone.
graph LR
    subgraph "PtrSet -- open addressing"
        A[Object address] --> B["hash = address >> 3<br/>no mixing"]
        B --> C[index = hash & mask]
        C --> D[Slot array]
        D --> E{Occupied?}

        E -->|"empty"| F[Not a member]
        E -->|"this key"| G[Member]
        E -->|"other key<br/>or tombstone"| H[probe i+1]
        H --> D
    end

    style B fill:#e1f5ff
    style G fill:#e1ffe1
Two properties are deliberate and easy to undo by accident:
- The hash is unmixed. Allocator addresses arrive in rising runs, so an unmixed hash keeps objects allocated near each other in slots near each other and a probe reuses the cache line the last one pulled in. Fibonacci mixing scatters them and costs a miss per lookup: over 2M realistic addresses, insert 6.8 ns and lookup 4.0 ns unmixed against 9.4 ns and 8.2 ns mixed.
- There is no reference counting. Collection is generational mark-and-sweep. The header carries
GC_MARK_BIT,GC_OLD_BIT,GC_RSET_BITandGC_TRACED_BIT, and nothing counts references.
This replaced a std::unordered_set in v2026.9.7. That container is node-based, so every insert was a separate heap allocation, and the old generation gains one entry per promoted object — a minor collection paid that allocation once per survivor, on top of the object's own. On Windows it cost 239.5 ns per insert against the allocation's 38.5 ns. Promotion cost tracks promoted bytes rather than collection count, so it dominated: binarytrees(17) went from 2.392 s to 1.789 s (−25.2%) with peak RSS 194.6 MB → 179.1 MB, closing a 3.5× gap against Linux on the same hardware. ptr_set_test.cpp pins the behaviour the collector relies on, including that count() never dereferences its argument.
GC Algorithm Flow
sequenceDiagram
    participant App as Application
    participant MM as Memory Manager
    participant YG as Young Gen
    participant OG as Old Gen

    App->>MM: Allocate object
    MM->>YG: Allocate in young gen
    YG->>MM: Return pointer
    MM->>App: Object ready

    Note over YG: Young gen fills up

    YG->>MM: Trigger GC (nursery full, or old generation past its threshold)
    MM->>App: Stop the World (every other thread parks)

    MM->>MM: Mark phase (from roots, and the dirty list on a minor GC)
    MM->>YG: Mark reachable objects
    MM->>OG: Mark reachable objects (major GC)

    MM->>MM: Promote survivors
    YG->>OG: Copy each marked young object, leave a forwarding address
    MM->>MM: Fix up roots and old objects to the new addresses
    MM->>YG: Reset the nursery (nothing in it is swept)

    MM->>OG: Major GC only: sweep unmarked old objects into the free lists

    MM->>App: Resume execution
Memory Manager Improvements
mindmap
    root((Memory Manager))
        Constant-time lookups
            Open-addressed old-gen set
            No per-entry allocation
            No linear scans
        Generational collection
            Young gen frequent and fast
            Old gen infrequent and thorough
            Survivors promoted with forwarding pointers
        Old-gen sweeping in place
            No old-object copying
            Better cache locality
Where Allocations Go
| Region | What lands there | Collected by |
|---|---|---|
| Nursery (young) | Objects, bump-allocated in one contiguous region: 128 MB reserved (YOUNG_REGION_SIZE), its usable limit set by --nursery / OBJECK_NURSERY; on Windows only the limit is committed | Minor GC: survivors promoted to the old generation, references fixed up |
| Old generation | Promoted objects, arrays, objects larger than the nursery limit, and every allocation a native library makes; each tracked in PtrSet | Major GC: mark and sweep in place |
| Operand and call stacks | Locals, frames, temporaries | Scanned as roots, never collected |
When Collections Run
- Minor collections run when the nursery fills.
- Major collections run when the old generation outgrows its threshold. After each major the next threshold is twice the live heap, never below 8 MB, so collection work stays proportional to allocation (before v2026.10.2 it grew only after eight majors in a row freed nothing, and a program holding a large table collected on nearly every array allocation).
--gc-thresholdsets the threshold. It holds as given while a major leaves at least a quarter of it free, which is what lets a stress run such as the nightly--gc-threshold=64kcollect every 64 KB; once more than three quarters of it survive, it scales with the live heap like the default, and returns to the given value once the live heap fits under it again.- Freed old-generation blocks go to one free list per size class, four classes per power of two from 16 bytes to 4 MB, so a reuse is a single pop rather than a search.
Key Characteristics:
- O(1) Membership: the old generation is an open-addressed address set; no linear scans
- Generational: a nursery that moves survivors (promote-and-forward with pointer fixup); an old generation swept in place
- Write barrier: a store of a young object into an old one is recorded on a lock-free dirty list, so a minor GC need not scan the whole old generation; C++ code that stores into an old object must call
WriteBarrier - Stop-the-World: cooperative, at safepoints (above)
Source Files:
core/vm/arch/memory.h/cpp- Memory manager: allocation, collection, write barriercore/vm/arch/ptr_set.h- Old-generation address setcore/vm/arch/memory_verify.cpp- Heap verifier (OBJECK_GC_VERIFY)
9. Platform Abstraction
Cross-platform system call abstraction for POSIX and Win32.
graph TB
    subgraph "Application Layer"
        A[Objeck Program]
    end

    subgraph "VM & Libraries"
        B[Runtime Interpreter]
        C[JIT Compiled Code]
        D[Standard Libraries]
    end

    subgraph "Host API Layer"
        E[Host APIs<br/>Platform Abstraction]
    end

    subgraph "Platform Implementations"
        F1[POSIX APIs]
        F2[Win32 APIs]

        G1[File I/O]
        G2[Networking]
        G3[Threading]
        G4[Dynamic Loading]
        G5[System Calls]

        F1 --> G1 & G2 & G3 & G4 & G5
        F2 --> G1 & G2 & G3 & G4 & G5
    end

    subgraph "Operating Systems"
        H1[Linux]
        H2[macOS]
        H3[Windows]
    end

    A --> B & C & D
    B & C & D --> E
    E --> F1 & F2
    G1 & G2 & G3 & G4 & G5 --> H1 & H2 & H3

    style E fill:#fff4e1
    style F1 fill:#e1f5ff
    style F2 fill:#e1f5ff
Platform-Specific Implementations
graph LR
    subgraph "File I/O"
        A1[open/read/write] -->|POSIX| B1[open/read/write syscalls]
        A1 -->|Win32| B2[CreateFile/ReadFile/WriteFile]
    end

    subgraph "Threading"
        A2[Thread Create] -->|POSIX| C1[pthread_create]
        A2 -->|Win32| C2[CreateThread]

        A3[Mutex] -->|POSIX| C3[pthread_mutex_*]
        A3 -->|Win32| C4[CreateMutex/WaitForSingleObject]
    end

    subgraph "Networking"
        A4[Socket] -->|POSIX| D1[socket/bind/listen]
        A4 -->|Win32| D2[WSASocket/bind/listen]
        A6[HTTP/2] --> D3[nghttp2 + mbedTLS/OpenSSL]
        A7[HTTP/3] -->|POSIX| D4[ngtcp2 + nghttp3 + AWS-LC, static]
        A7 -->|Win32| D5[WinHTTP over MsQuic]
    end

    subgraph "Dynamic Loading"
        A5[Load Library] -->|POSIX| E1[dlopen/dlsym]
        A5 -->|Win32| E2[LoadLibrary/GetProcAddress]
    end

    style A1 fill:#fff4e1
    style A2 fill:#fff4e1
    style A4 fill:#fff4e1
    style A6 fill:#fff4e1
    style A7 fill:#fff4e1
    style A5 fill:#fff4e1
HTTP Protocol Stack
Three protocols, and they do not share a serialization path — which is the single most important thing to know before touching this code.
| Protocol | Where the request is built | Engine |
|---|---|---|
| HTTP/1.1, HTTPS | Objeck (net.obs, net_secure.obs) — assembled as text | sockets + mbedTLS/OpenSSL |
| HTTP/2 | Native (common.cpp) | nghttp2, all platforms |
| HTTP/3 | Native (common.cpp) | ngtcp2 + nghttp3 + AWS-LC on POSIX, linked statically (tools/deps/build_quic_deps.sh); WinHTTP over MsQuic on Windows 11 / Server 2022+ |
Consequences that have each produced a real bug:
- Request headers. HTTP/1.1 serializes headers in Objeck, so
AddHeaderworked there from the start. HTTP/2 and HTTP/3 hand off to a trap, and for a long time that trap had no headers argument — soAddHeaderstored values that were silently dropped. They now travel as aString[]of alternating key/value throughHTTP2_REQUEST_HDRS/HTTP3_REQUEST_HDRS. - Header validation lives in Objeck (
Web.HTTP.HeaderCheck), not in the trap, precisely because HTTP/1.1 never reaches native code. A trap-side check could not have covered the line-oriented protocol where injection is worst. The native validators are defence in depth for the two protocols that do cross into C++. - HTTP/3 on Windows must assert the negotiated protocol. WinHTTP treats HTTP/3 as a preference and falls back to HTTP/2 or HTTP/1.1 transparently, so a 200 proves nothing. Every request checks
WINHTTP_OPTION_HTTP_PROTOCOL_USEDand fails unless HTTP/3 was really used. (Also non-obvious:WINHTTP_OPTION_ENABLE_HTTP_PROTOCOLmust be set on the session handle before the request is created; setting it later is accepted and silently ignored.) - Capability is reportable. The traps compile unconditionally, so the presence of
Http3Clientproves nothing about whether an engine is behind it.Runtime->GetProperty("runtime.feature.http3")(and.http2) returns"1"only when one is compiled in — which is how a caller, or a test, tells unsupported apart from the network failed. The msys2 Windows builds have no HTTP/3 engine and correctly report"0".
Threading Model
sequenceDiagram
    participant Main as Main Thread
    participant VM as VM Thread Manager
    participant T1 as Worker Thread 1
    participant T2 as Worker Thread 2
    participant GC as GC Thread

    Main->>VM: Create thread
    VM->>T1: Start execution

    Main->>VM: Create thread
    VM->>T2: Start execution

    T1->>T1: Execute bytecode
    T2->>T2: Execute bytecode

    Note over T1,T2: GC triggered

    VM->>GC: Start GC
    GC->>T1: Suspend (safepoint)
    GC->>T2: Suspend (safepoint)

    GC->>GC: Mark & Sweep

    GC->>T1: Resume
    GC->>T2: Resume

    T1->>VM: Thread complete
    T2->>VM: Thread complete
Platform Detection
| Platform | Macro | Compiler | ABI |
|---|---|---|---|
| Linux x64 | __linux__ && __x86_64__ | GCC/Clang | System V AMD64 |
| Linux ARM64 | __linux__ && __aarch64__ | GCC | ARM64 AAPCS |
| macOS ARM64 | __APPLE__ && __aarch64__ | Clang | ARM64 AAPCS |
| Windows x64 | _WIN32 && _WIN64 | MSVC | Microsoft x64 |
| Windows ARM64 | _WIN32 && _M_ARM64 | MSVC | Microsoft ARM64 |
Source Files:
core/vm/arch/posix/posix.h- POSIX abstractionscore/vm/arch/win32/win32.h/cpp- Win32 abstractionscore/shared/sys.h/cpp- Cross-platform utilities
10. Runtime Errors
Errors are objects. System.Error and its subclasses are raised with Runtime->Raise and caught by type with try { } on(e : T) { } finally { }; the runtime's own faults are raised the same way, as NilError, IndexError, DivideByZeroError, CastError and RuntimeError. ?-> still recovers from any error in a call chain, yielding Nil. An error nothing handles ends the program.
try {
  port := ParsePort(text, line);   # may Runtime->Raise(ConfigError->New(...))
}
on(e : ConfigError) {               # clauses are tested in order
  "line {$(e->GetLine())}: {$(e->GetMessage())}"->PrintLine();
}
on(e : Error) {                     # a catch-all goes last
  e->GetMessage()->PrintLine();
}
finally {                           # runs on every way out, return/break/continue included
  "checked"->PrintLine();
};
flowchart TB
    A["Error raised<br/>Runtime->Raise, or a runtime fault:<br/>Nil, index, divide by zero, cast"] --> B{"Handler on this<br/>thread's handler stack?"}
    B -->|yes| C["TryErrorRecovery: pop frames back to<br/>the handler's, restore the operand stack"]
    C --> D{"Which construct?"}
    D -->|"?-> / Try()"| E["The guarded chain yields Nil<br/>(?? may supply a default)"]
    D -->|"try / on"| F["First clause whose type matches runs;<br/>no match: the error goes on after finally"]
    F --> H["finally runs"]
    B -->|no| G["Message on stderr, the call stack,<br/>exit with status 1 (obd halts instead)"]

    style E fill:#e1ffe1
    style H fill:#e1ffe1
    style G fill:#ffe1e1
try/on/finally(EmitTry, design indocs/ERROR_HANDLING_DESIGN.md). The words are contextual, so no existing name stops compiling. The body runs in aTRY_START/TRY_ENDregion; its handler fetches the error withGetLastErrorand tests each clause's type in order. The clauses run in a region of their own, sofinallyruns before an error raised in a clause goes on. An error no clause names is raised again afterfinally, so a typedtrynever swallows what it did not ask for. Areturn,breakorcontinuethat leaves thetrycloses its region and runsfinallyon the way out.- Fatal unless handled. The interpreter prints one
>>> ... <<<line, such as>>> Attempting to dereference a 'Nil' memory instance <<<,>>> Index out of bounds: <index>,<size> <<<or>>> Divide by zero <<<, then lists the methods on the call stack (StackErrorUnwind) and exits with status 1. An invalid cast (>>> Invalid object cast ... <<<) and a full call stack are recovered like the rest when they happen in interpreted code. An invalid cast is now recovered inside a JIT-compiled method too (#925): the handler stack is per-thread, so the bridge callback that raises the cast can see it, and the callback reports a status (-5) that compiled code tests and carries out through its epilogue, where the interpreter already recovers a guard stub's status. The diagnostic is printed only when no handler is active, so a recovered cast is as silent as it is in interpreted code. A full call stack is recovered in compiled code too (since 2026-10): compiled frames consume the real C stack, which used to run out first and end the process in the OS. The compiled call site now tests the native stack as well as the depth (two compares a call; see Call Depth in section 3), so the call that would overrun it fails as a full call stack does, with no compiled frame left mid-way. Try()and?->.a?->b()isa->Try()->b(). The compiler brackets the rest of the chain withTRY_STARTandTRY_END(EmitTryIntrinsic);TRY_STARTpushes a handler, with the operand-stack position and call-stack depth to return to, on the thread's handler stack (which grows as needed). On aNildereference, a bad index or a zero divisor,TryErrorRecoverypops frames back to that depth, restores the operand stack and resumes at the handler, which storesNilas the chain's value, andRuntime->GetLastError()says what it was. A compiled callee that returns one of those errors as its status is recovered the same way.Otherwise()and??.a ?? bisa->Otherwise(b): aNiltest, not a handler, sobis evaluated only whenaisNil.- The JIT leaves try regions alone.
TRY_STARTandTRY_ENDare in neither backend's whitelist, so a method that holds a?->or atrystays interpreted: recovery needs the interpreter's handler stack. Errors raised inside a compiled callee still reach it. - Under the debugger (
obd, built with_NO_HALT) an unguarded error halts the program instead of exiting, and DAP "uncaught" exception breakpoints stop there first (Debugger::OnRuntimeError). - Faults in the VM itself, a C++ exception such as
std::bad_alloc, are caught at the top ofExecute, or by the JIT bridge under compiled code, and reported as>>> virtual machine: ... <<<.
Source Files:
core/compiler/intermediate.cpp-EmitTry,EmitTryIntrinsic,EmitOtherwiseIntrinsiccore/compiler/lib_src/lang.obs-System.Errorand its subclasses,Runtime->Raise,Runtime->GetLastErrorcore/vm/interpreter.h- the handler stack (PushTryHandler,TryErrorRecovery)core/vm/dispatch.cpp-TRY_START,TRY_ENDcore/vm/interpreter.cpp- error messages andStackErrorUnwind
Summary
This architecture demonstrates a modern, multi-platform language implementation with:
✅ Multi-tiered Execution: Interpreter → call counting → JIT compilation ✅ Platform-Specific JIT: Optimized ARM64 and x64 code generation ✅ Efficient Memory Management: O(1) lookups, generational GC ✅ Structured Errors: try/on/finally over typed Error objects, plus ?-> recovery ✅ Rich Library Ecosystem: 46 libraries including AI/ML, web servers ✅ Modern Development Tools: REPL, debugger, LSP support ✅ Automated CI/CD: Multi-platform testing with caching ✅ Cross-Platform: Linux x64/ARM64, macOS ARM64 (Apple silicon), Windows x64/ARM64 ✅ Full Unicode: Emoji and supplementary plane characters on all platforms including Windows console
For More Information:
Contributing: See CONTRIBUTING.md for guidelines on improving this architecture.
Last updated: October 2026 | Version: 2026.10.2